executive summary
operating modes
a dash dashboard can be used like a regular Python script, i.e.
python my-dash-board.pybut note however that this will only start a web server, and display the URL that you need to point your browser to - typically something like http://127.0.0.1:8050
connecting data
tightly integrated with plotly - pro or con
if you know about plotly already, then this is certainly a pro
however if you don’t, it means you are not going to be able to use your matplotlib skills, and will have to re-learn a lot; certainly a con...
pandas-friendly
most of the examples use a dataframe as their input; which is fine, until you want to play with numpy arrays instead, where things tend to become a little overcomplex
tutorial and examples
on the website
the dash tutorial can be found here
https://dash .plotly .com /tutorial a wide range of examples can be found here https://
plotly .com /examples/
simple ones
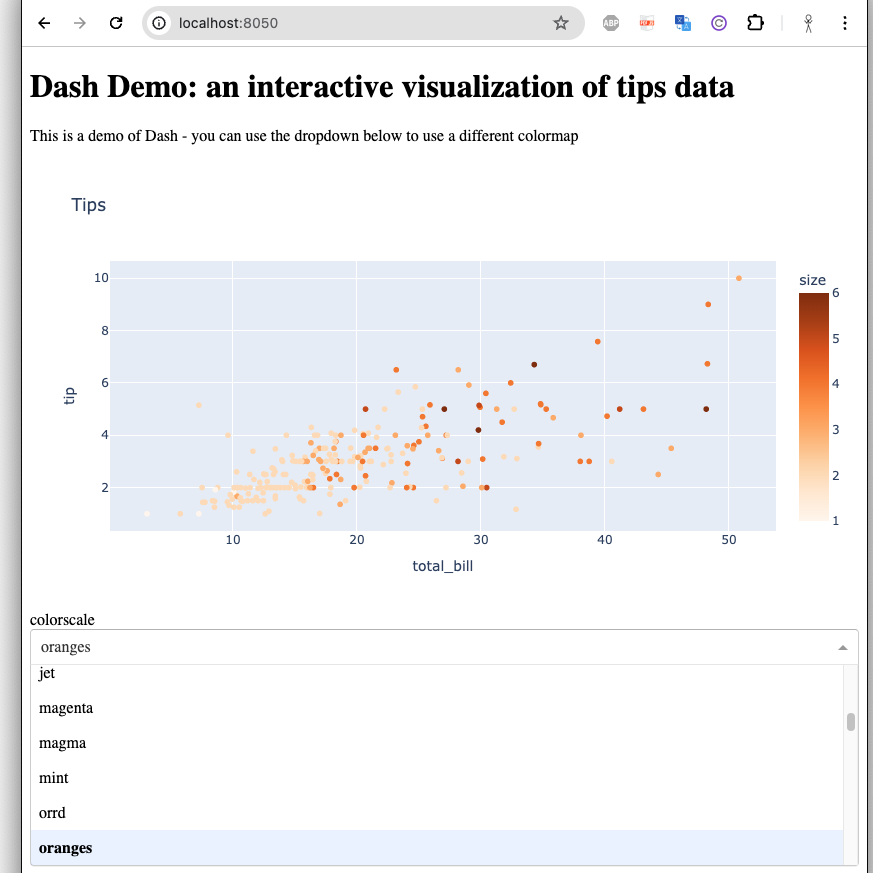
in addition to those, you will find in the attached zip:
a simplistic visualization app; it just shows how to use a dropdown to select a parameter (here the colorscale) of a given visualization