In this assignment we study how health and wealth relate across the world, using indicators published by the World Bank. The data comes in several separate files, so we will
merge them into a single, clean dataframe
group and pivot the result
see how a pivot table relates to
groupby+unstackplot with
df.plot()and with seaborn’spairplot
import numpy as np
import pandas as pd
import seaborn as sns
# optional
import itables
itables.init_notebook_mode()the data
there are four files in the data/ folder
| file | one row per | main column |
|---|---|---|
life-expectancy.csv | country and year | life_exp (years) |
gdp-per-capita.csv | country and year | gdp_per_capita (current US$) |
population.csv | country and year | population |
countries.csv | country | region, income_level |
loading
load each of the four files into a dataframe, named respectively life, gdp, pop and countries
and have a look at each of them: shape, first rows, types
# your codecontent
to better understand what we have at hand, answer these questions
how many rows do we have in each table
the three indicator files have the same columns
country_code,country,year
what are the rows that identify a measure uniquely ? so, what are the two columns we need to merge on ?
hint
now could be the right time to check for df.duplicated()
merging
how many rows for the merge ?
we’re trying to foresee how many rows a merge would yield
the three files do not have the same number of rows: what does that tell you ?
it is not enough to conclude by itself, we need to know how the keys of the 3 dataframes compare:
how do the keys of
lifeandpopcompare ?same question for
lifeandgdp?and so, how many rows do you expect from an inner merge
and from an outer merge ? how many undefined data will the outer merge contain ?
hint
a common trick is to:
compute the index made of the key columns:
keys = df.set_index([..., ...]).indexand then use set-like operations (
difference,intersection,union) on these keys;note however that
==to compare 2 indexes is not the right tool here consider usingsymmetric_difference()instead
# your codemerging the indicators
merge life, gdp and pop into a single dataframe indicators, with these 6 columns
country_code, country, year, life_exp, gdp_per_capita, population
do this twice:
once with the default merge,
and once with
how="outer"compare the number of rows with the expectations
finally check for missing data in both; does that add up with the previous question ?
hint
the country column is already in life, so you do not want to get it again from the other dataframes
# your codewhich kind of merge do you prefer here, and why ?
(for the rest of the assignment, we keep the outer version, to see the missing values)
adding the regions
now we want to add the region and income_level columns to indicators, taken from countries
this time we merge on one column only: country_code
how many rows do you expect in the result ?
(for a given country, is there one row or several in thecountriestable ?)merge, and call the result
df; check that you get the number of rows you expectedyou now have both a
countryand anamecolumn, that seem to contain the same thing; (optional step) double-check they genuinely are identicaldrop the
namecolumn
hint
maybe Series.is_unique can come in handy
# your codecleaning
look at the values in the
regioncolumn:value_counts()should show you something that is not a regionlook at some entries in this category, to check it’s safe to remove
remove those entries
hints
in the World Bank data, groups like World or Euro area are mixed with actual countries; they have a
regionof"Aggregates"maybe time to check for
df.sample()
# your codecomputing decade
as we have not yet seen how to deal with time-related data, we will
add a column decade (like 1990, 2000, 2010, 2020) computed from year as an integer
hint
the integer division // can help to compute the decade
# your codegroupby
compute the average life expectancy for each region
then do the same for each pair
(region, decade)what is the type of the index of this last result ?
look at the
levelsattribute of this index; what do you find in there ?
# your codepivot_table
build a table with one row per region, one column per decade, and the average life expectancy in each cell
# your codestack and unstack
you have just seen two ways to compute almost the same thing: the 2-level groupby result, and the pivot table
use unstack() on the former to obtain the latter, and check that they are equal
(see also DataFrame.equals, or pd.testing.assert_frame_equal)
# your codeand conversely, what does stack() do when applied on the pivot table ?
# your codeso, in a nutshell: pivot_table(index=A, columns=B, values=C) is the same as groupby([A, B])[C].mean().unstack()
(and the pivot table can do more, e.g. several aggregation functions or margins=True)
plotting with pandas
use
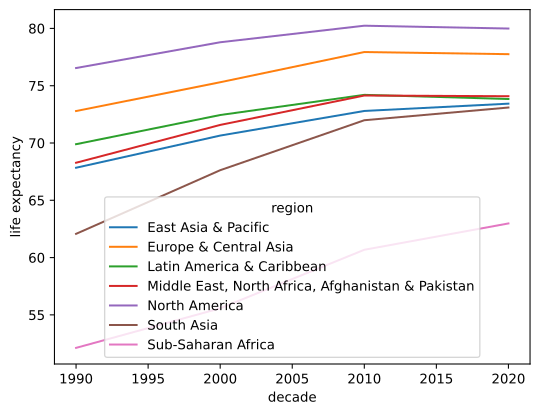
pivotedto draw one curve per region, showing how the life expectancy evolves over decades
the result should look like this
hint
df.plot() draws one curve per column, with the index on the x axis; so you may need to transpose first
# your codenow a bar chart (
kind="barh"ordf.plot.barh()) of the average life expectancy per region for the most recent decade only (the column2020)
# your codefinally, a scatter plot of
life_expagainstgdp_per_capitafor year 2019, usingdf.plot.scatter()
use a log scale on the x axis (logx=True) to make it readable
# your codepairplot
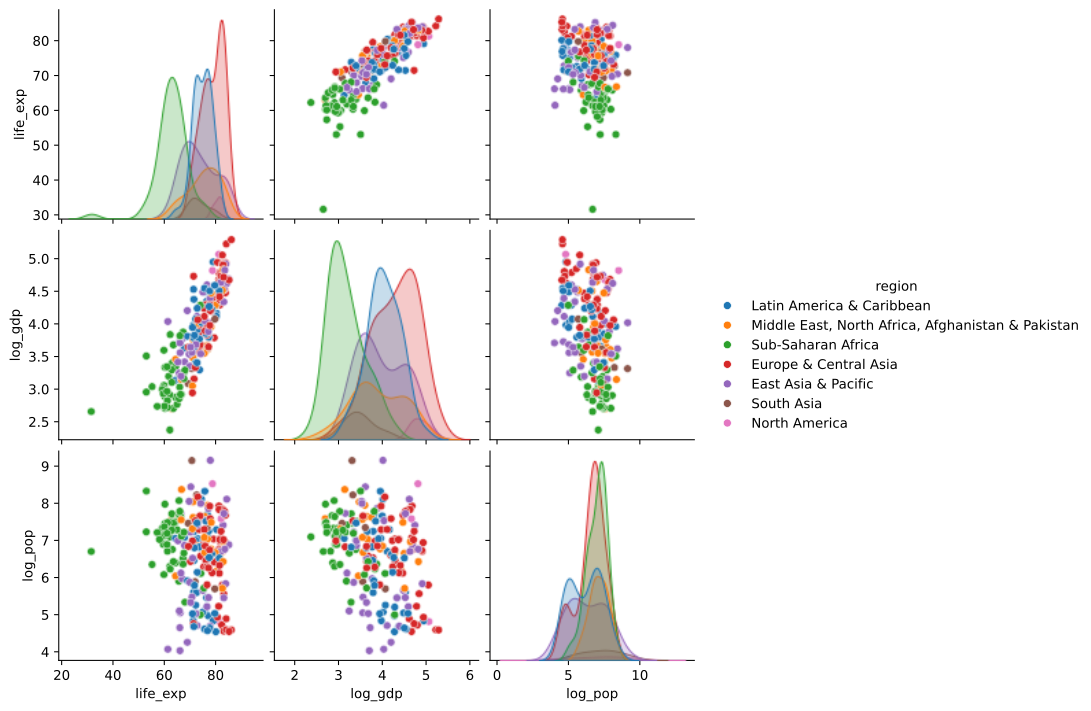
seaborn’s pairplot() draws, for a set of numerical columns:
the histogram of each column (on the diagonal), and
the scatter plot of every pair
see this page for a short intro to seaborn
on the 2019 data, draw a
pairplotof the columnslife_exp,gdp_per_capitaandpopulation, with a color perregionthe result is not very readable; why ? try to fix this by using the logarithm of the two last columns (
numpy.log10)
you should produce something like this:
# your codeoptional: going further
how many countries are there in each (region, income level) pair ?
build the table with one row per region, one column per income level, and add the totals with margins=True
hint
here you want to count different countries: look at nunique() as an aggregation function
and what about regions that have no country in some income level ?
# your codeappendix: weighting by population
in the groupby section, we have computed the mean over countries
to get the life expectancy of the people of a region, each country should be weighted by its population
there is no weighted mean in groupby, but a weighted mean is sum(life_exp * population) / sum(population)
so compute these two sums by (region, decade), and divide them
hint
first build the product
life_exp * population, e.g. withassign()rows where
life_exporpopulationis missing must be removed first; otherwise, the two sums do not cover the same countriesthe result can be reshaped with
unstack()to look likepivoted
# your codeappendix: where does the data come from
all the data was downloaded once from the World Bank open data API, restricted to the years 1990 to 2020
life expectancy at birth: indicator
SP.DYN.LE00.INGDP per capita, current US$: indicator
NY.GDP.PCAP.CDtotal population: indicator
SP.POP.TOTLcountry metadata (region, income level): the
countryendpoint
for example, with httpie, the life expectancy for all countries, in 2019 only, as json (format==json and the other == are query parameters)
http "https://api.worldbank.org/v2/country/all/indicator/SP.DYN.LE00.IN" format==json date==2019 per_page==300for the years used here, replace the date with date==1990:2020, and use per_page==20000 to get everything in one page
the country metadata is at https://api.worldbank.org/v2/country
the script fetch-data.py, next to this notebook, does the whole job with Python’s requests library instead
rows with no value were dropped from the three indicator files, which is why they do not all cover the same country / year pairs